Methodology
Movement activity of devices observed at the gathering site (Target devices) during the event period was analyzed for 2 weeks immediately following the event (post-event period). Below is what we observed:
Figure 1: Cumulative footfall of target devices observed in the post-event period
The above infographic provides a qualitative estimate of how much did these devices travel in the subsequent 2 weeks. We also quantified the above by calculating total distance travelled by target devices in the post event period. As can be inferred from Figure 1, devices have travelled to almost all major cities in Malaysia. Our calculation suggests that median distance travelled by a device in this 2 week period stood at ~600 km. Below is the distance distribution we observed.
Figure 2: Histogram depicting total distance travelled by target devices in the post event period (Bin size 100km)
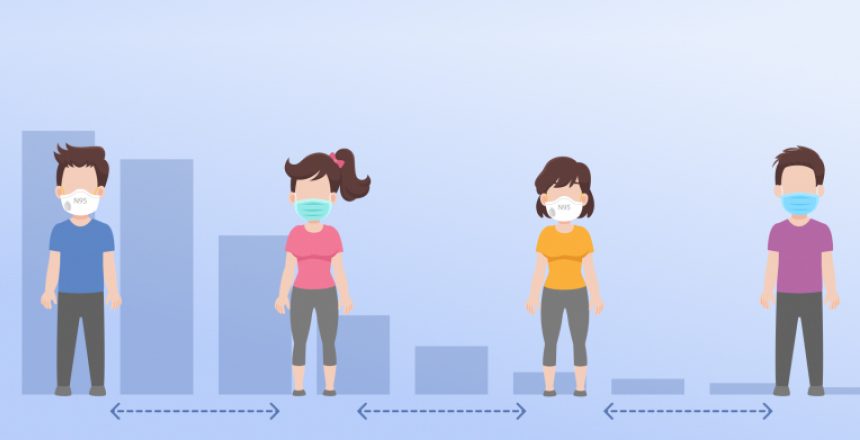
The scale of gathering (estimated at ~ 16,000) and their subsequent travel clearly highlights the need for social distancing that is being so vehemently promoted by governments. While it is difficult to establish a causal relationship between the gathering and the spike in COVID-19 cases, there does seem to be a correlation based on the incubation period commonly reported (5-11 days)
Figure 3: Timeline of daily increase in reported COVID-19 cases in Malaysia
Next, we analyzed the potential hotspots within the city of Kuala Lumpur that may emerge based on the visitation behaviour of these target devices. The infographic below shows a heatmap for COVID 19 vulnerability of regions in KL (dark red highlighting maximum risk).
Figure 4: Scoring of hexbins by aggregating the total count of target devices observed in that region in the post event period
Lastly, we also looked at the home country of attendees as the event was reported to have an international audience. As per our estimate, nearly 10-12% of the attendees were foreign nationals with Indonesia contributing the maximum.
To summarise, our study provides some qualitative and quantitative support for social distancing and stricter border control.
You may also like


![[Blogpost ]Enhancing Customer Experience with POI Data Insights Enhance customer experience using POI data](https://www.factori.ai/wp-content/uploads/Blogpost-Enhancing-Customer-Experience-with-POI-Data-Insights-scaled.png)


